Section 3: Data Cleaning
Contents
Section 3: Data Cleaning
We will now switch to analysing our data in a statistical program. Excel and Google Sheets will be referred to here, and can be accessed for free online using your Cambridge ID. If you are used to using a different program such as RStats, SPSS, Stata or Python you may also use this to clean and analyse your data.
Copy the first text file into a spreadsheet, remove unnecessary data.
Before you can analyse the data, you need to find a way to clean it. By default, the text files created in MEA consist of a series of numbers, each separated by a space. Each line represents a frame of video, and each number is the amount of motion within an ROI during that frame.
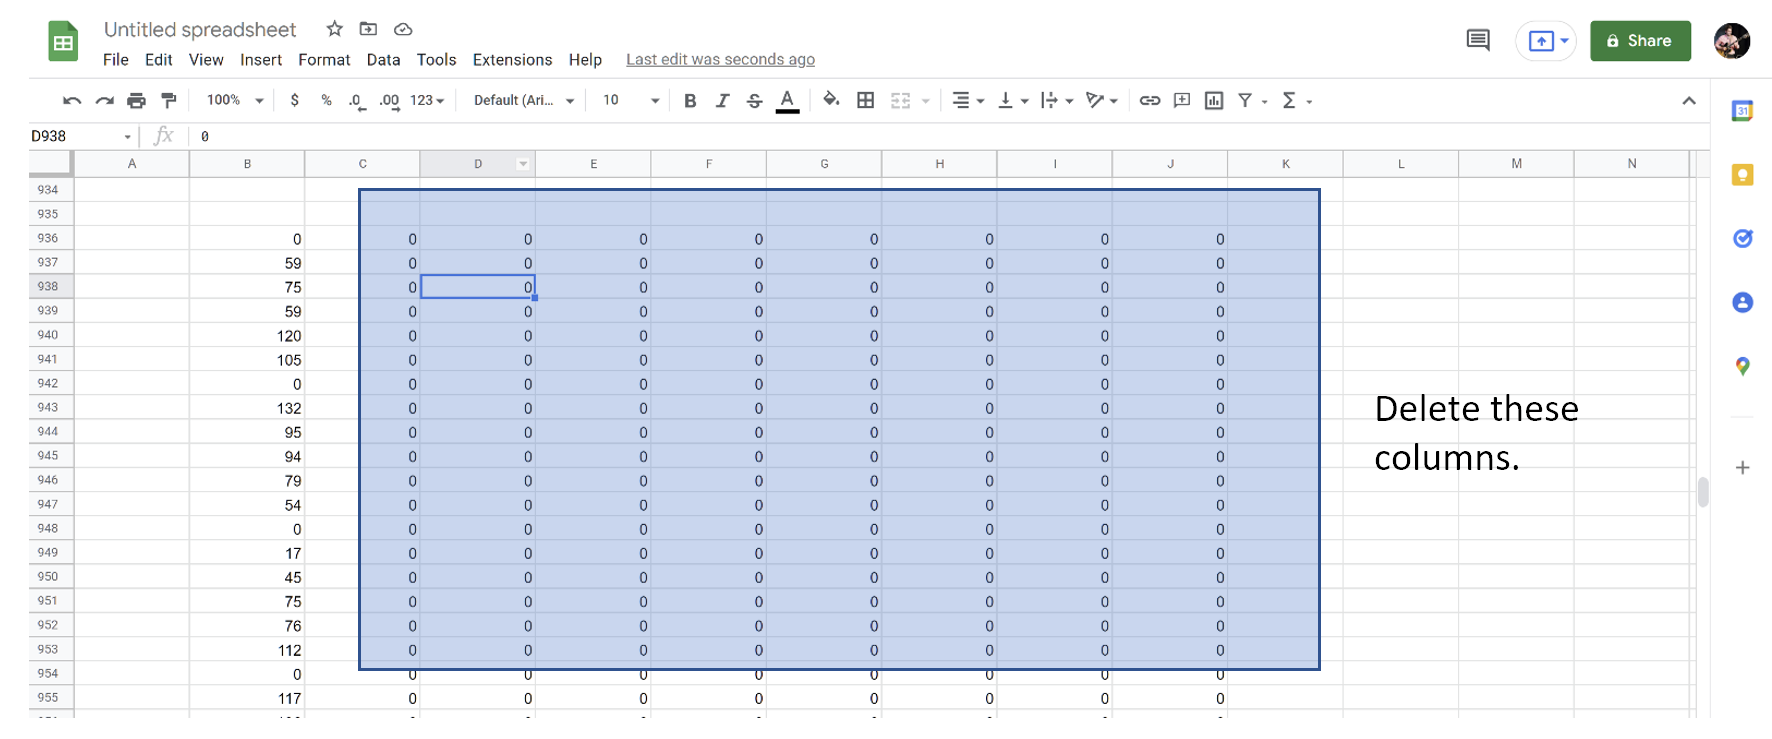
Unfortunately, we cannot tell MEA to ignore the ROIs we have not specified when creating a text output. This means that the unused ROIs will be represented as a series of zeros which we’ll need to remove.
Copy the whole text file into your spreadsheet. It will load in as a single column. Highlight this column, then click Data - Text to Columns and apply (on Excel) or Data - Split Text to Columns (Google Sheets). In both cases, make sure that the delimiter is set to Space. You may then delete the columns filled with zeros.
Expected result:
Copy the second text file and repeat the cleaning.
Now, repeat this process for the second text file. You should end up with two columns, one for each video
Scale the data to enable comparison between videos
You might have noticed that, depending on how large you made each ROI, the range of values given out by MEA can be very large – from zero to several thousand, for instance. This is because each value depends on the number of pixels contained within each ROI: larger ROIs will lead to larger potential maxima. To enable comparison between both videos, we can scale each column so that they have the same maximum and minimum. For simplicity, we’ll scale between 0 and 1.
Create a new column next to your first column of data. In the first cell of this column, enter the following formula:
=(data - min($start_$cell:$end_$cell)) / (max($start_$cell:$end_$cell) - min($start_$cell:$end_$cell))
So, to scale a data point in cell B1 within the range of cells B1:B9:
=(B1 - min($B$1:$B$9)) / (max($B$1:$B$9) - min($B$1:$B$9))
Now, click and drag the new cell down, and you should see a new value for every cell in your original dataset. These will be scaled between 0 and 1, so that a value of 0 is equivalent to the smallest value in the dataset and 1 the largest.
Note
The dollar signs included here are really important, as they tell the program to use the same range of values when scaling each individual cell. If you find yourself getting DIV/0 or other errors when using the formula, make sure you’ve added them!
Finally, repeat the above process for the second column of values you’ve obtained for the second video.